Coginitve ergonomics analysis
Coginitve ergonomics analysis
Coginitve ergonomics analysis
m-indicator
m-indicator
m-indicator
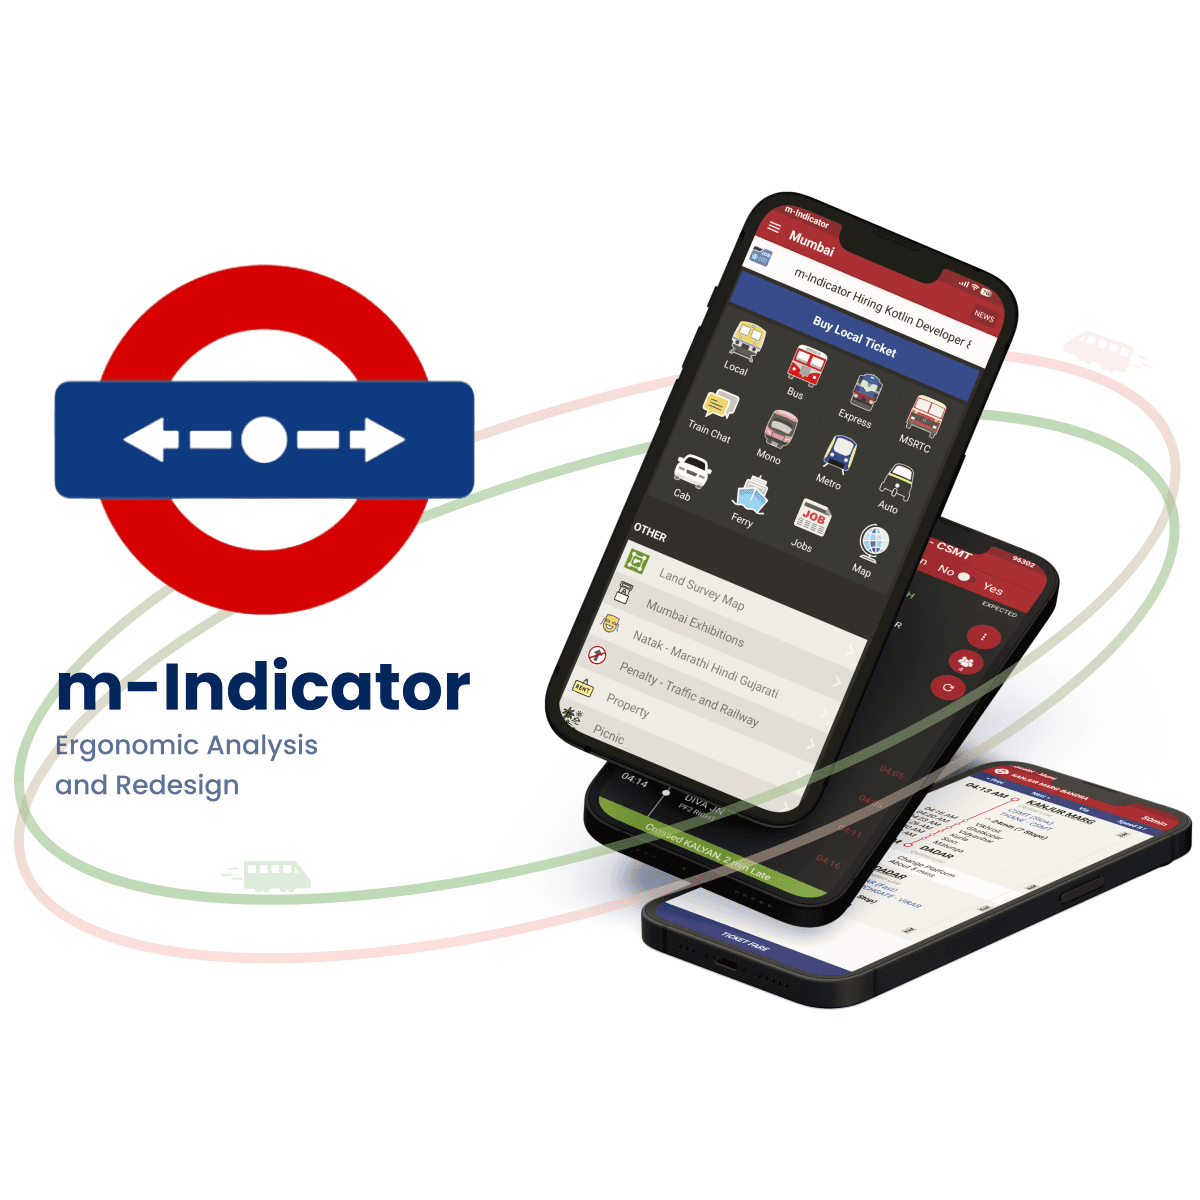
Cognitive ergonomics analysis of the M-Indicator app.
Cognitive ergonomics analysis of the M-Indicator app.
My Role
My Role
Usability Research, Cognitive Analysis, Prototyping & Ideation
Usability Research, Cognitive Analysis, Prototyping & Ideation
Usability Research, Cognitive Analysis, Prototyping & Ideation
Team Members
Team Members
Ananya, Gaurav, Naman, Vansh
Ananya, Gaurav, Naman, Vansh
Ananya, Gaurav, Naman, Vansh
Timeline
Timeline
2 Weeks
2 Weeks
2 Weeks


What is M-indicator
What is M-indicator
What is M-indicator
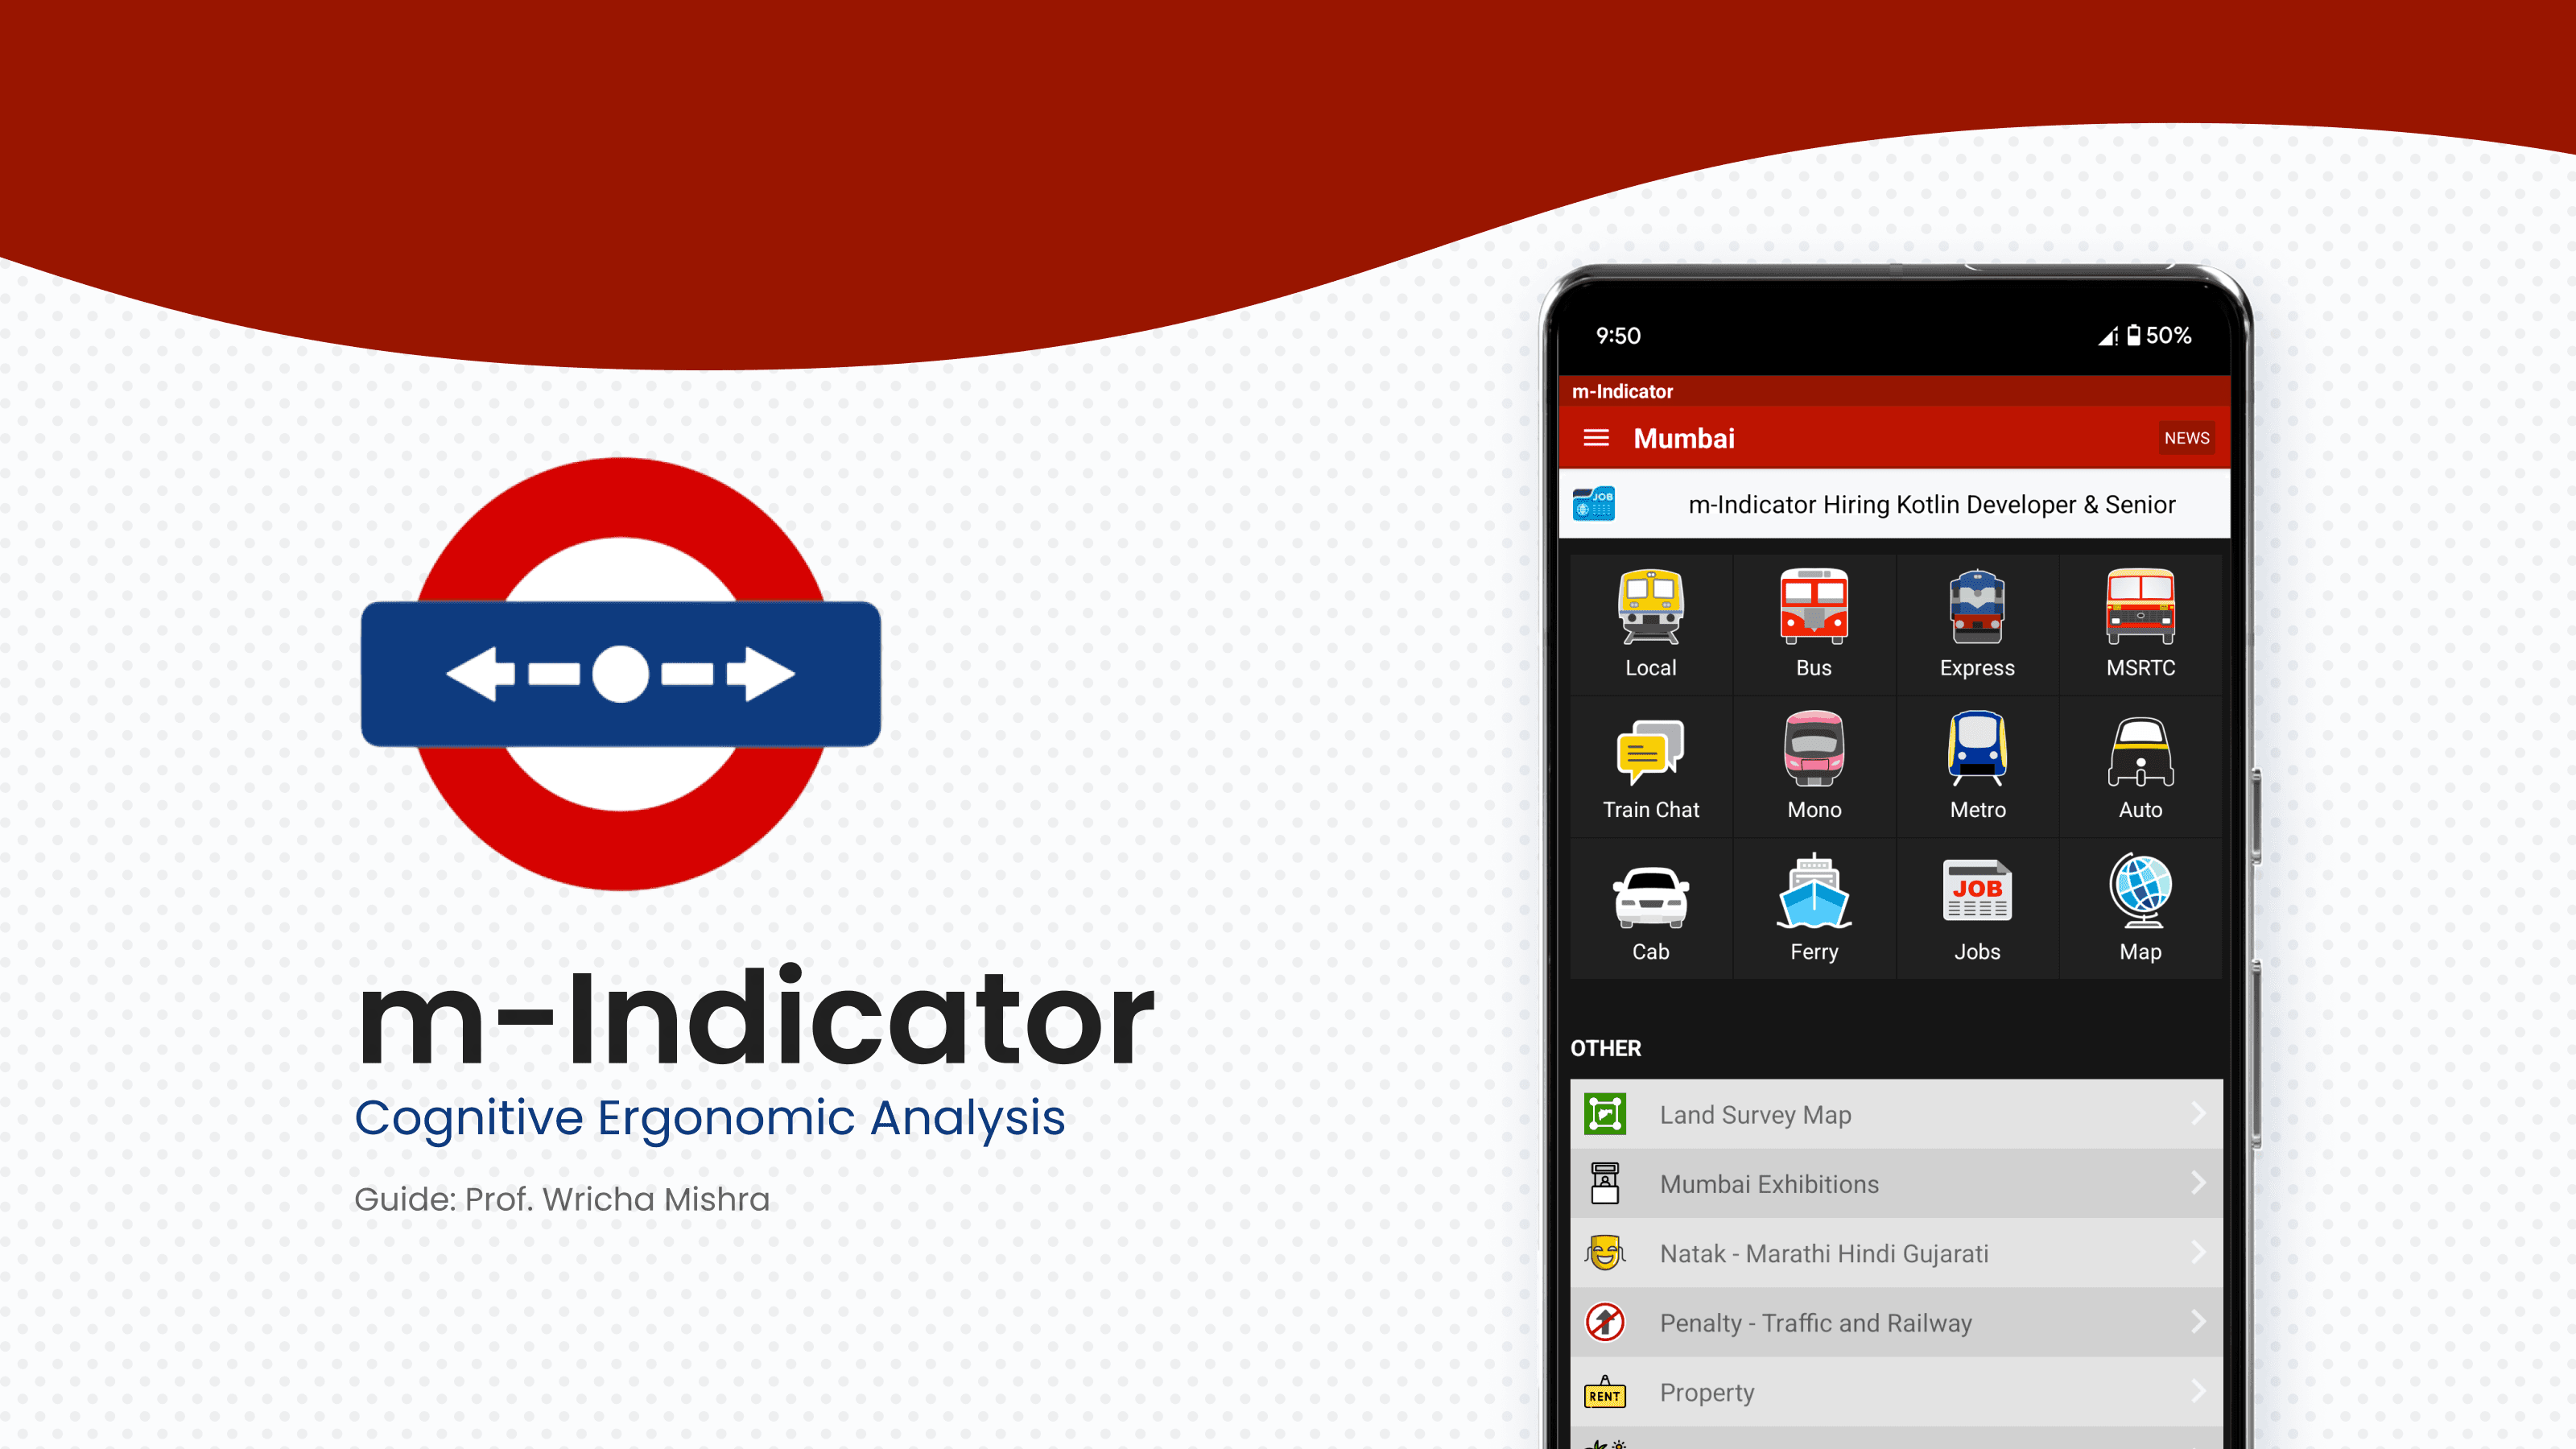
m-Indicator is a public transportation app for Mumbai and Pune, providing real-time updates on 232 trains and commuter-shared alerts. It helps over 75 lakh users access train schedules and navigate their daily commutes.
m-Indicator is a public transportation app for Mumbai and Pune, providing real-time updates on 232 trains and commuter-shared alerts. It helps over 75 lakh users access train schedules and navigate their daily commutes.
m-Indicator is a public transportation app for Mumbai and Pune, providing real-time updates on 232 trains and commuter-shared alerts. It helps over 75 lakh users access train schedules and navigate their daily commutes.
Objective
Objective
Objective
This study assesses the cognitive ergonomics and usability of the M-Indicator app, aiming to simplify navigation, reduce cognitive load, and improve efficiency, effectiveness, and user satisfaction for a seamless commuter experience.
This study assesses the cognitive ergonomics and usability of the M-Indicator app, aiming to simplify navigation, reduce cognitive load, and improve efficiency, effectiveness, and user satisfaction for a seamless commuter experience.
This study assesses the cognitive ergonomics and usability of the M-Indicator app, aiming to simplify navigation, reduce cognitive load, and improve efficiency, effectiveness, and user satisfaction for a seamless commuter experience.
Process
Process
Process


Analyse
Analyse
Analyse
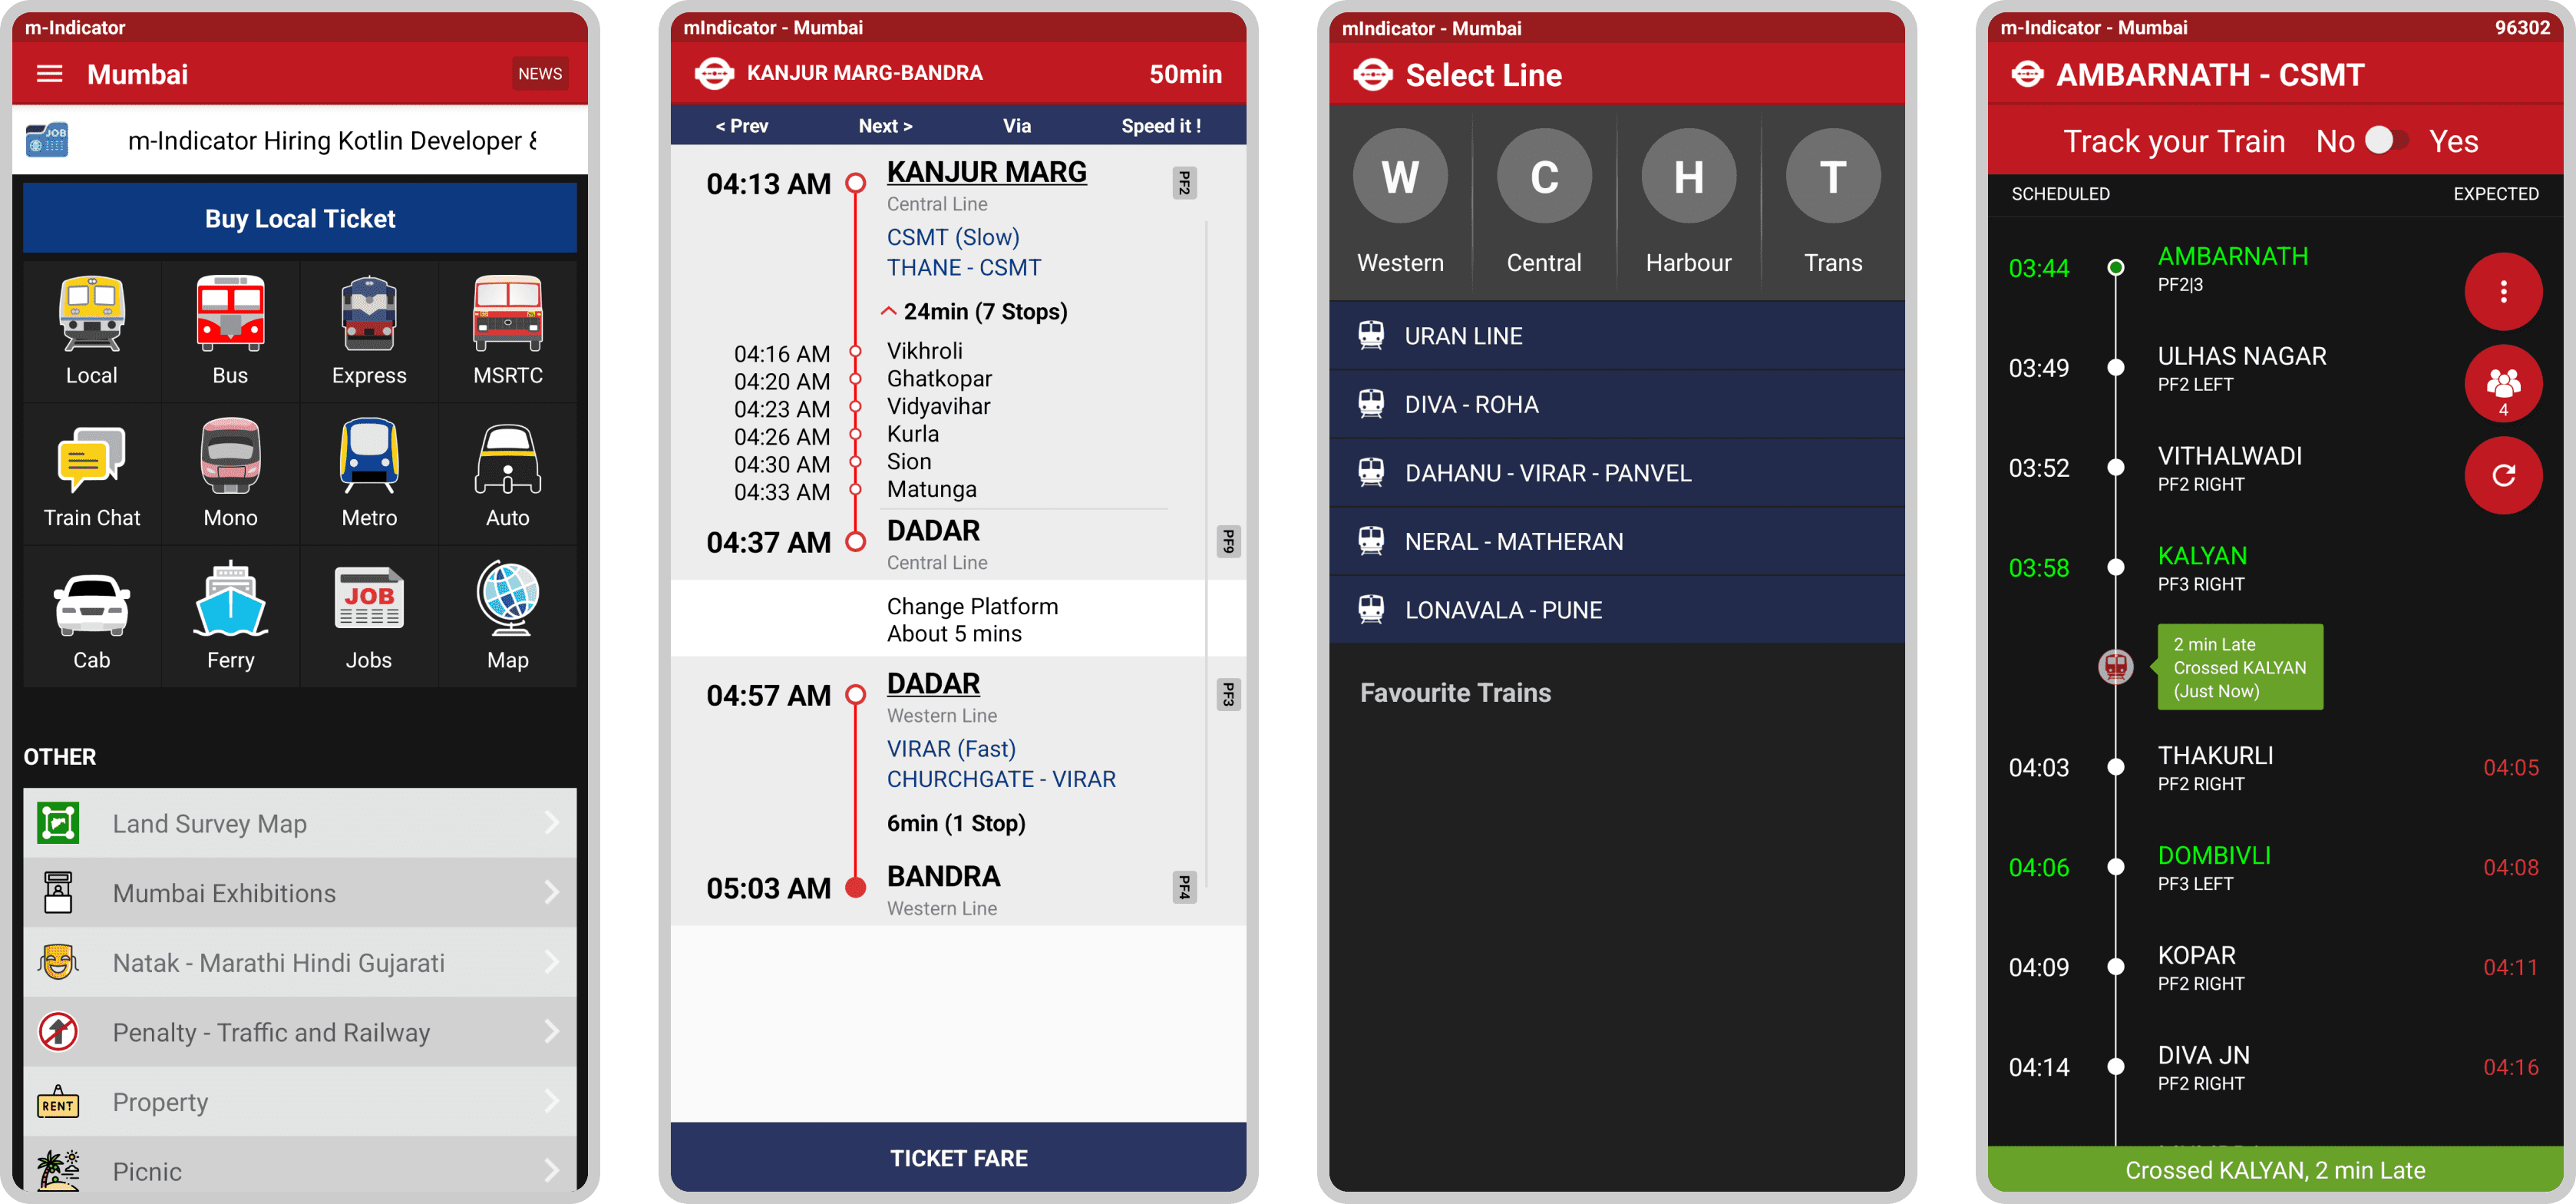


Current m-Indicator Application V17.0.308, 07 Aug 2024
Information Achitechture
Information Achitechture
Information Achitechture
Evaulation Methods
Evaulation Methods
Evaulation Methods


Tasks
Tasks
Tasks
Tasks were divided into two categories: basic and advanced.
Users were assessed through a series of questions, with tasks assigned based on their responses. This approach ensured task difficulty matched the user's capabilities for a more accurate evaluation of usability.
Tasks were divided into two categories: basic and advanced.
Users were assessed through a series of questions, with tasks assigned based on their responses. This approach ensured task difficulty matched the user's capabilities for a more accurate evaluation of usability.
Tasks were divided into two categories: basic and advanced.
Users were assessed through a series of questions, with tasks assigned based on their responses. This approach ensured task difficulty matched the user's capabilities for a more accurate evaluation of usability.


Hers's a list of the evaluated tasks:
Task 1: Find the train to go from Kanjurmarg to Vashi
Task 2: Commuting to Airport Road metro station from Kanjurmarg railway station.
Task 3: Take the first morning train from Kanjurmarg to CSMT.
Task 4: Find buses from Dadar to Pune.
Task 5: Open station map of Titwala.
Task 6: Take the first morning train from Kanjurmarg to CSMT.
Task 7: You are travelling from kanjurmarg to Byculla, figure out which side platform to get off the train.
Task 8: Save Ghatkopar to CSMT as Favorite route.
Task 9: While travelling from Ghatkopar to CSMT, set an alarm for Byculla.
Task 10: Check live status of train going from Ghatkopar to CSMT


System Usability Score
System Usability Score
System Usability Score


Satisfaction is a test that helps in quantifying a qualitative property. A score above 68 is considered good.
Effectiveness and Efficiency are measurements of primitively quantitative data. They produce results that cannot be directly stated as good or bad. They are used later to compare with results taken after the redesign.


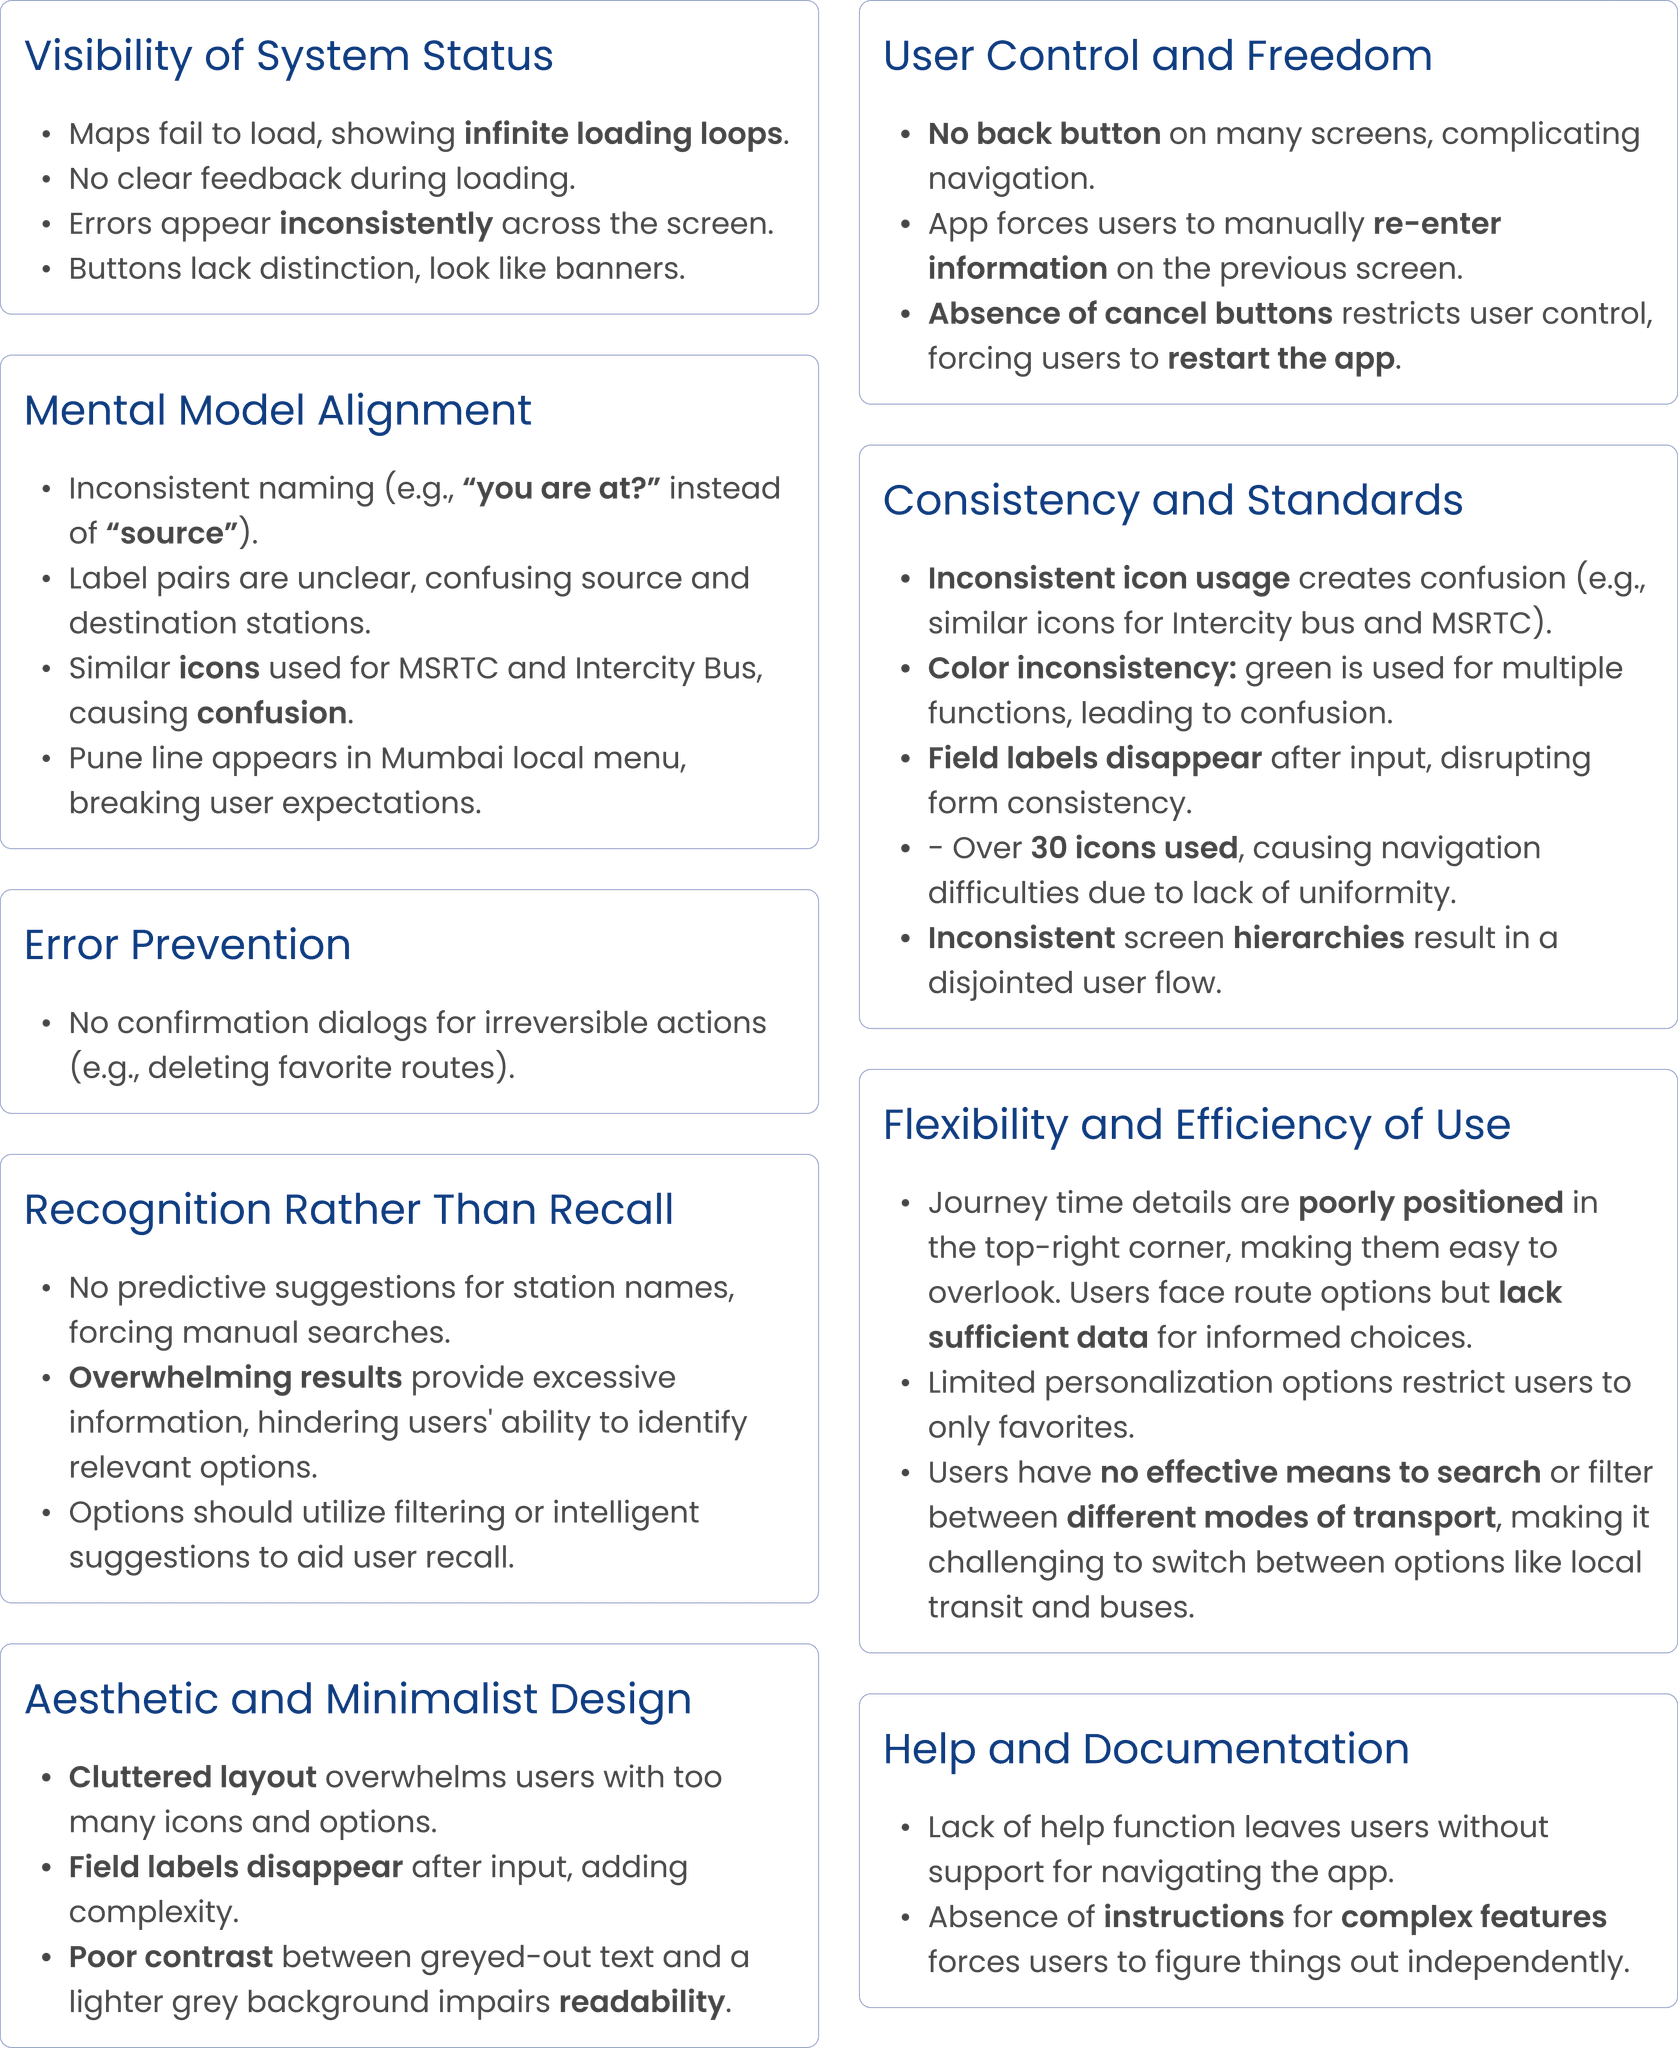
Heuristic Evaluation
Heuristic Evaluation
Heuristic Evaluation


NASA TLX
NASA TLX
NASA TLX
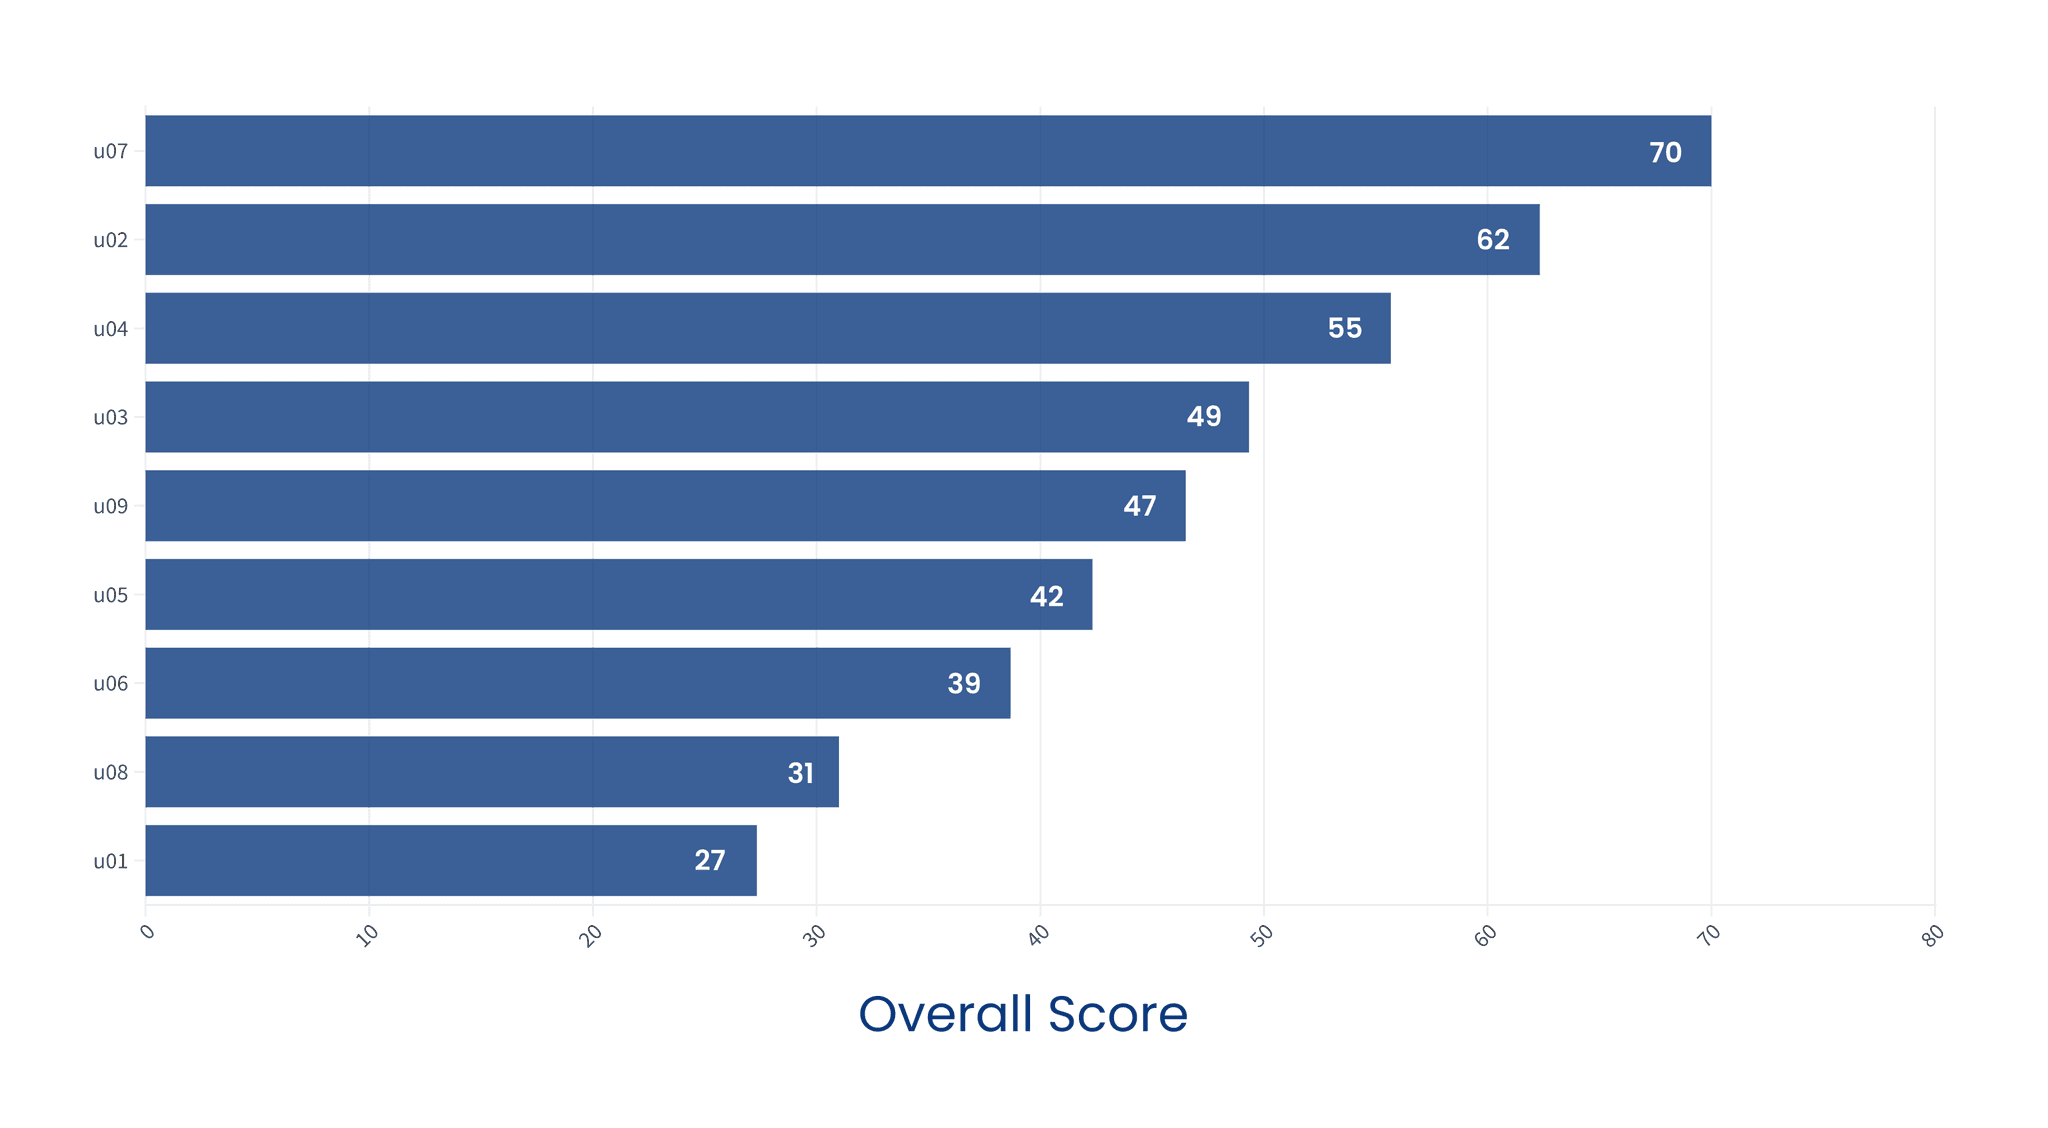
This bar graph shows the combined score of mental demand, physical demand, temporal demand, performance, effort and frustration.
This bar graph shows the combined score of mental demand, physical demand, temporal demand, performance, effort and frustration.
This bar graph shows the combined score of mental demand, physical demand, temporal demand, performance, effort and frustration.

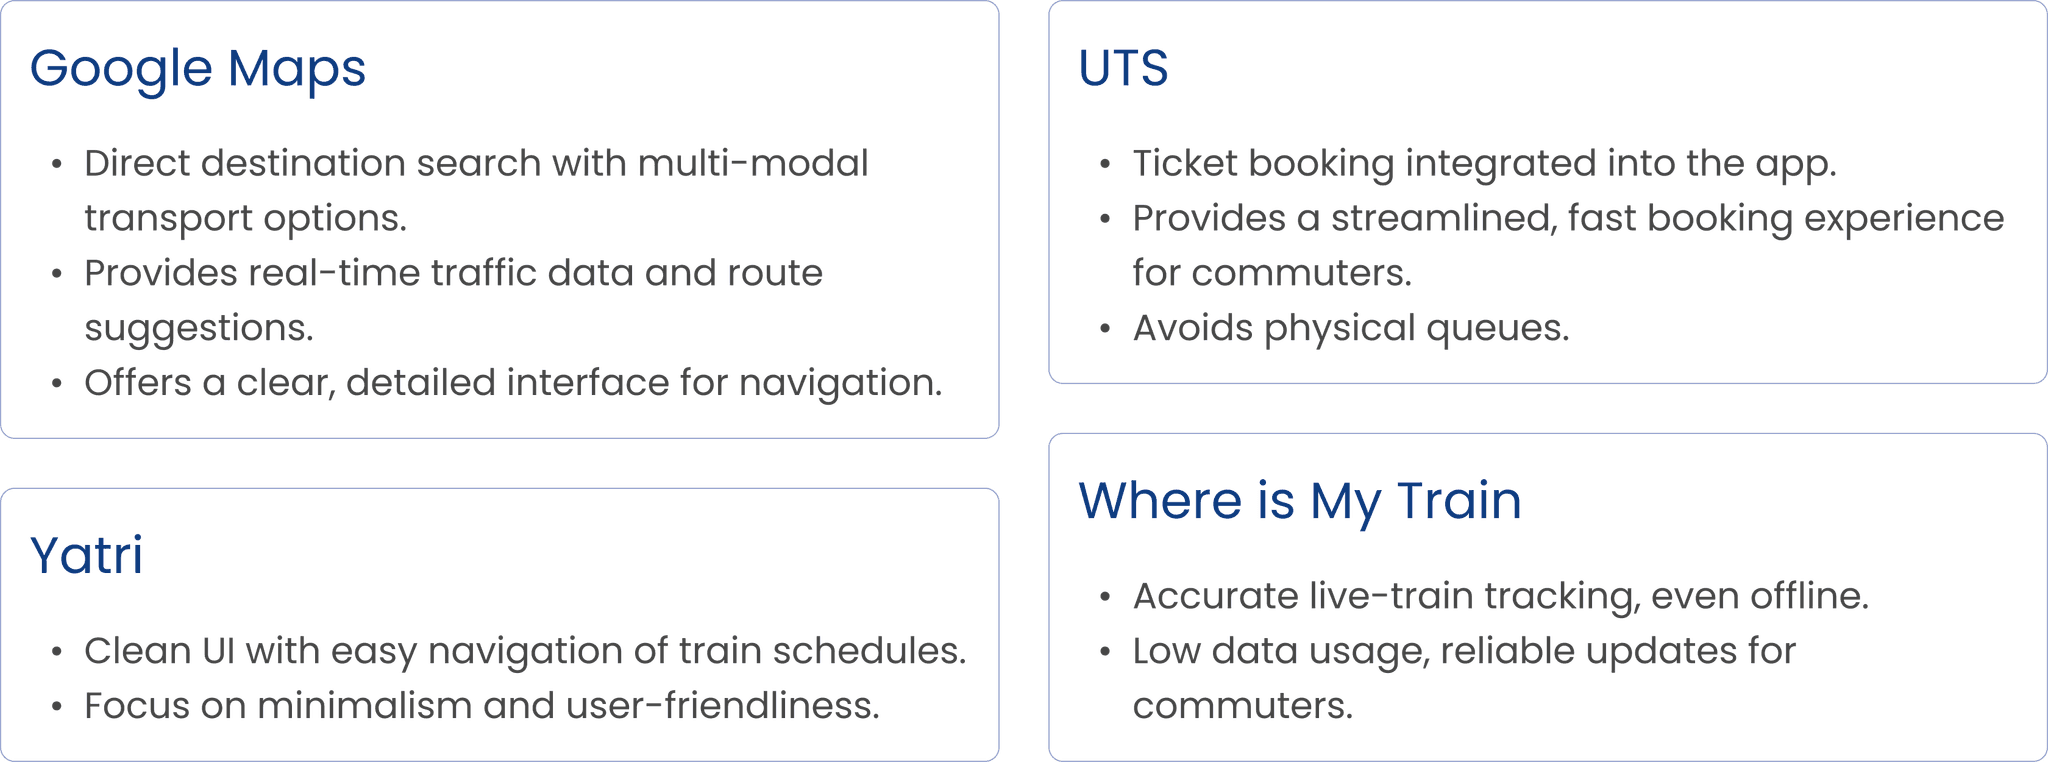
Competitor Analysis
Competitor Analysis
Competitor Analysis



Eye Tracking
Eye Tracking
Eye Tracking
We utilized Real Eye's eye-tracking technology to assess user gaze data on the M-Indicator app. The resulting heatmaps identified key focal areas, helping us prioritize and refine design elements based on where users naturally focus during interactions.
We utilized Real Eye's eye-tracking technology to assess user gaze data on the M-Indicator app. The resulting heatmaps identified key focal areas, helping us prioritize and refine design elements based on where users naturally focus during interactions.


Articulate
Articulate
Articulate


Ideate
Ideate
Ideate


